Edgematic Dashboard
A key advantage of using the Edgematic platform is the ability to realize complete computer Edge AI applications utilizing a graphical user interface. For this purpose, multiple elements of the tool need to be used in conjunction to visualize and analyze specific tasks such as application analyses and model performance estimation.
Upon successful login, the Project view (main page) in Edgematic displays, as shown in the figure below. This is where you get started by creating a new application with a unique name and specific requirements.
Project: Organize your applications and models as specific projects.
Project Name: Select a unique name for your project/s.
Recent / Templates: Pre-defined
Operating System: Pre-defined
Cores: Pre-defined
Install additional packages and libraries: Pre-defined

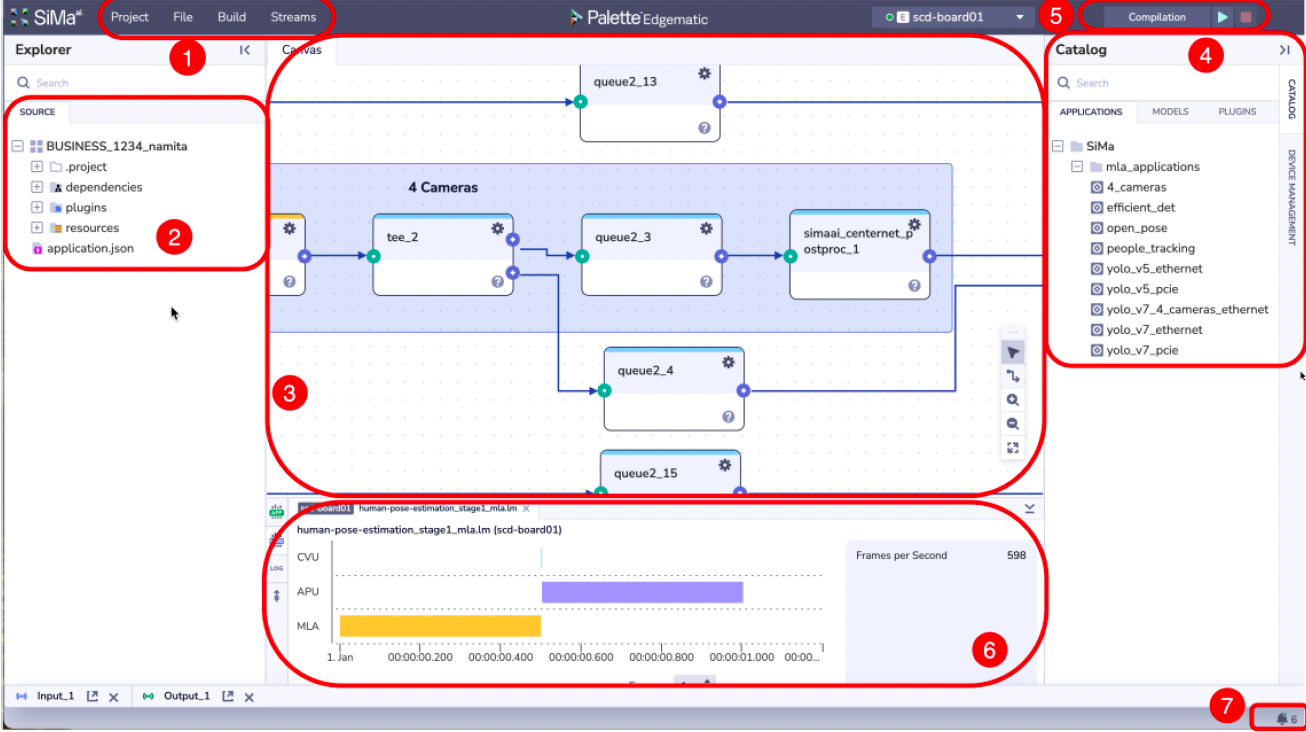
After you click Build and Create Your Custom Project, Edgematic’s main workspace, aka the dashboard, displays. The workspace for configuring your application and models has multiple components as shown in the figure below.
Most of the activities in the workspace can be carried out using simple mouse clicks. Drag-and drop using a mouse is needed for certain tasks such as running an application.
Number |
Component |
Description |
|---|---|---|
1 |
Toolbar |
Toolbar for managing projects, building executable, and assigning the input/output stream |
2 |
Explorer |
List of components used in building an application or model flow including ability to navigate to source files |
3 |
Canvas |
A visual representation of the components used in building applications and models and their interconnections |
4 |
Catalog |
A selectable list of available applications, models, and plugins |
5 |
Execution Bar |
Tool for defining the sequence of operations and launching them |
6 |
Log/KPI |
Area in the dashboard that displays metrics such as frames-per-second (FPS) |
7 |
Progress |
Area in the dashboard that displays progress of individual execution steps and possible failure |