Introduction to Edgematic
Edgematic is a UI-based development platform designed to build performant Edge AI applications with minimal coding. Built on Palette, it packages complete GStreamer applications using SiMa.ai’s optimized plugins for maximum runtime performance.
You can use it to:
Build pipelines from ready-made components.
Import your own models for performance testing, or test from the pre-loaded library of models.
Deploy and test optimized pipelines to SiMa.ai MLSoC hardware.
Typical users include:
AI developers looking to optimize their models for edge deployment.
Data scientists seeking a user-friendly platform for model evaluation and quantization.
System integrators aiming to create scalable, efficient AI solutions.
Anyone interested in exploring the intersection of AI, edge devices, and low-latency applications.
Getting Started
In the sections ahead, you will find step-by-step instructions, examples, and best practices to help you get started with Edgematic.
Layout
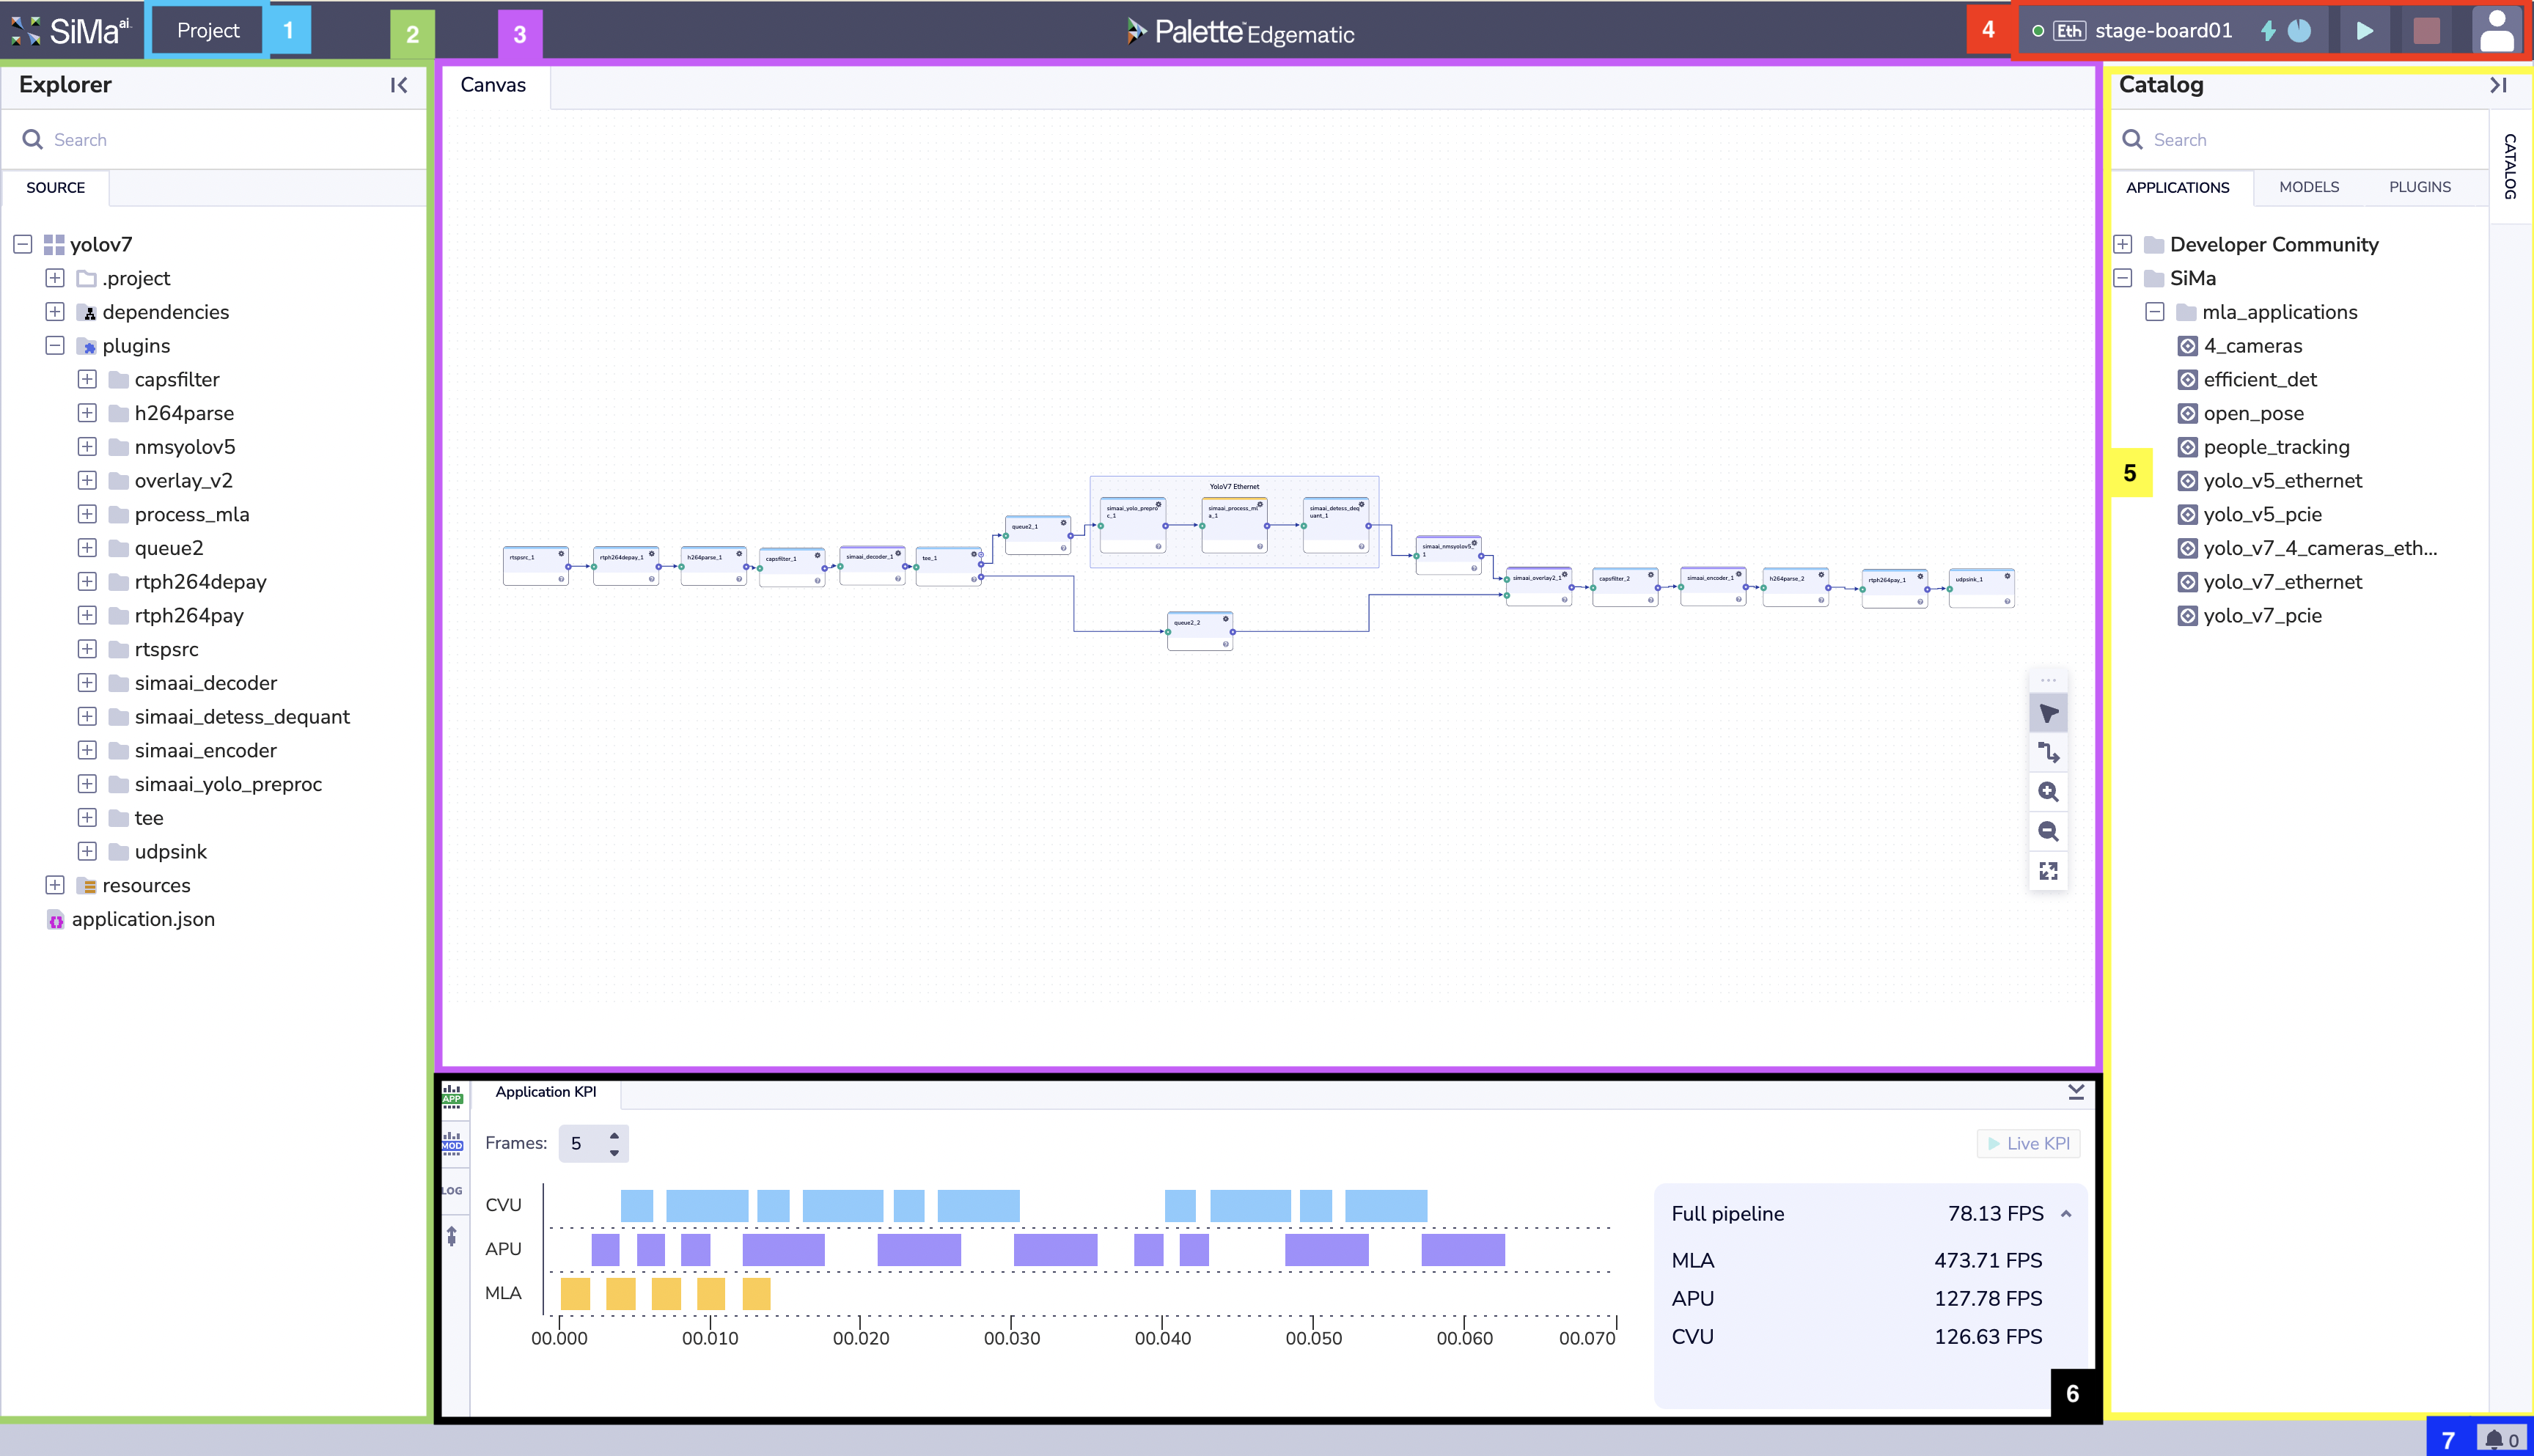
The Project menu allows user to do the following:
New / Open Recent - Create a new project or open a recently used project.
Download - Download the project. You can use the downloaded project to deploy the project/pipeline into a local device.
Builds - You can choose to re-deploy one of the builds that you built in the past.
Displays the file structure of the project, organizing files, folders, and dependencies for easy navigation.
Key Elements
- Project Files:
Contains project definitions, dependency information, and configuration files.
- Plugins:
Includes available modules such as
capsfilter,h264parse, andnmsyolov5that can be used within your pipeline.
- Resources:
Stores additional assets, including
application.json.
Users can utilize the search bar to quickly locate files within the project structure.
The Canvas is the visual interface for building and editing application pipelines.
Features
- Pipeline Blocks:
Drag and drop blocks such as
queue2,overlay_v2, andudp_sinkto configure workflows.
- Connections:
Link blocks to define the data flow between modules.
- Zoom and Pan Tools:
Adjust the view for detailed editing or a comprehensive overview.
The canvas provides a graphical representation of the processing pipeline, enabling intuitive design and configuration.
The Toolbar offers quick access to application controls and debugging tools.
Options Include
Board Status Indicator: The circle on the far left, next to the board name, indicates whether the board is powered on or off.
Connection Type: Displays how the board is connected to the server:
Ethfor Ethernet/networking connections orPCIefor PCI Express connections.Board Name: Shows the device name, e.g.,
stage-board01.Power Metrics: The lightning bolt icon indicates whether the board is connected to a power measurement station. This is used when users request model KPIs.
Allocation Clock: The green circle with a clock icon shows the remaining session time. Each user session is limited to one hour.
Play Button: Deploys the current application on the canvas to the specified device.
Stop Button: Stops the application currently running on the specified device.
Profile Button: Displays profile information and provides an option for users to sign out.
The Catalog offers quick access to applications, models and plugins validated and optimized by SiMa’s engineers for generic purposes. You can drag-and-drop these resources to start building your own projects.
Categories:
- Applications: Pre-configured applications like
yolo_v5_ethernetandpeople_tracking. The application catalog is divided into: - Developer Community
Within Developer Community you can find the same applications that you can find in the Developer Community Tab on the landing page.
- SiMa
Within SiMa you can find the same Applications that you can find in the Demo Tab on the landing page.
- Applications: Pre-configured applications like
Models: The model catalog has all the compiled models from our internal Model Zoo. These models offer the maximum FPS and Accuracy that the SiMa team was able to achieve. All the models have been trained in generic Dataset like COCO and Imagenet.
Plugins: The plugin catalog offers both sima specific plugins like how to do inference on our devices or pre and post processing. We also offer open source plugins like rtspsrc or udpsink.
The visualization toggle provides several key functions, allowing users to access application and model KPIs, system and device logs, as well as remote device terminal access.
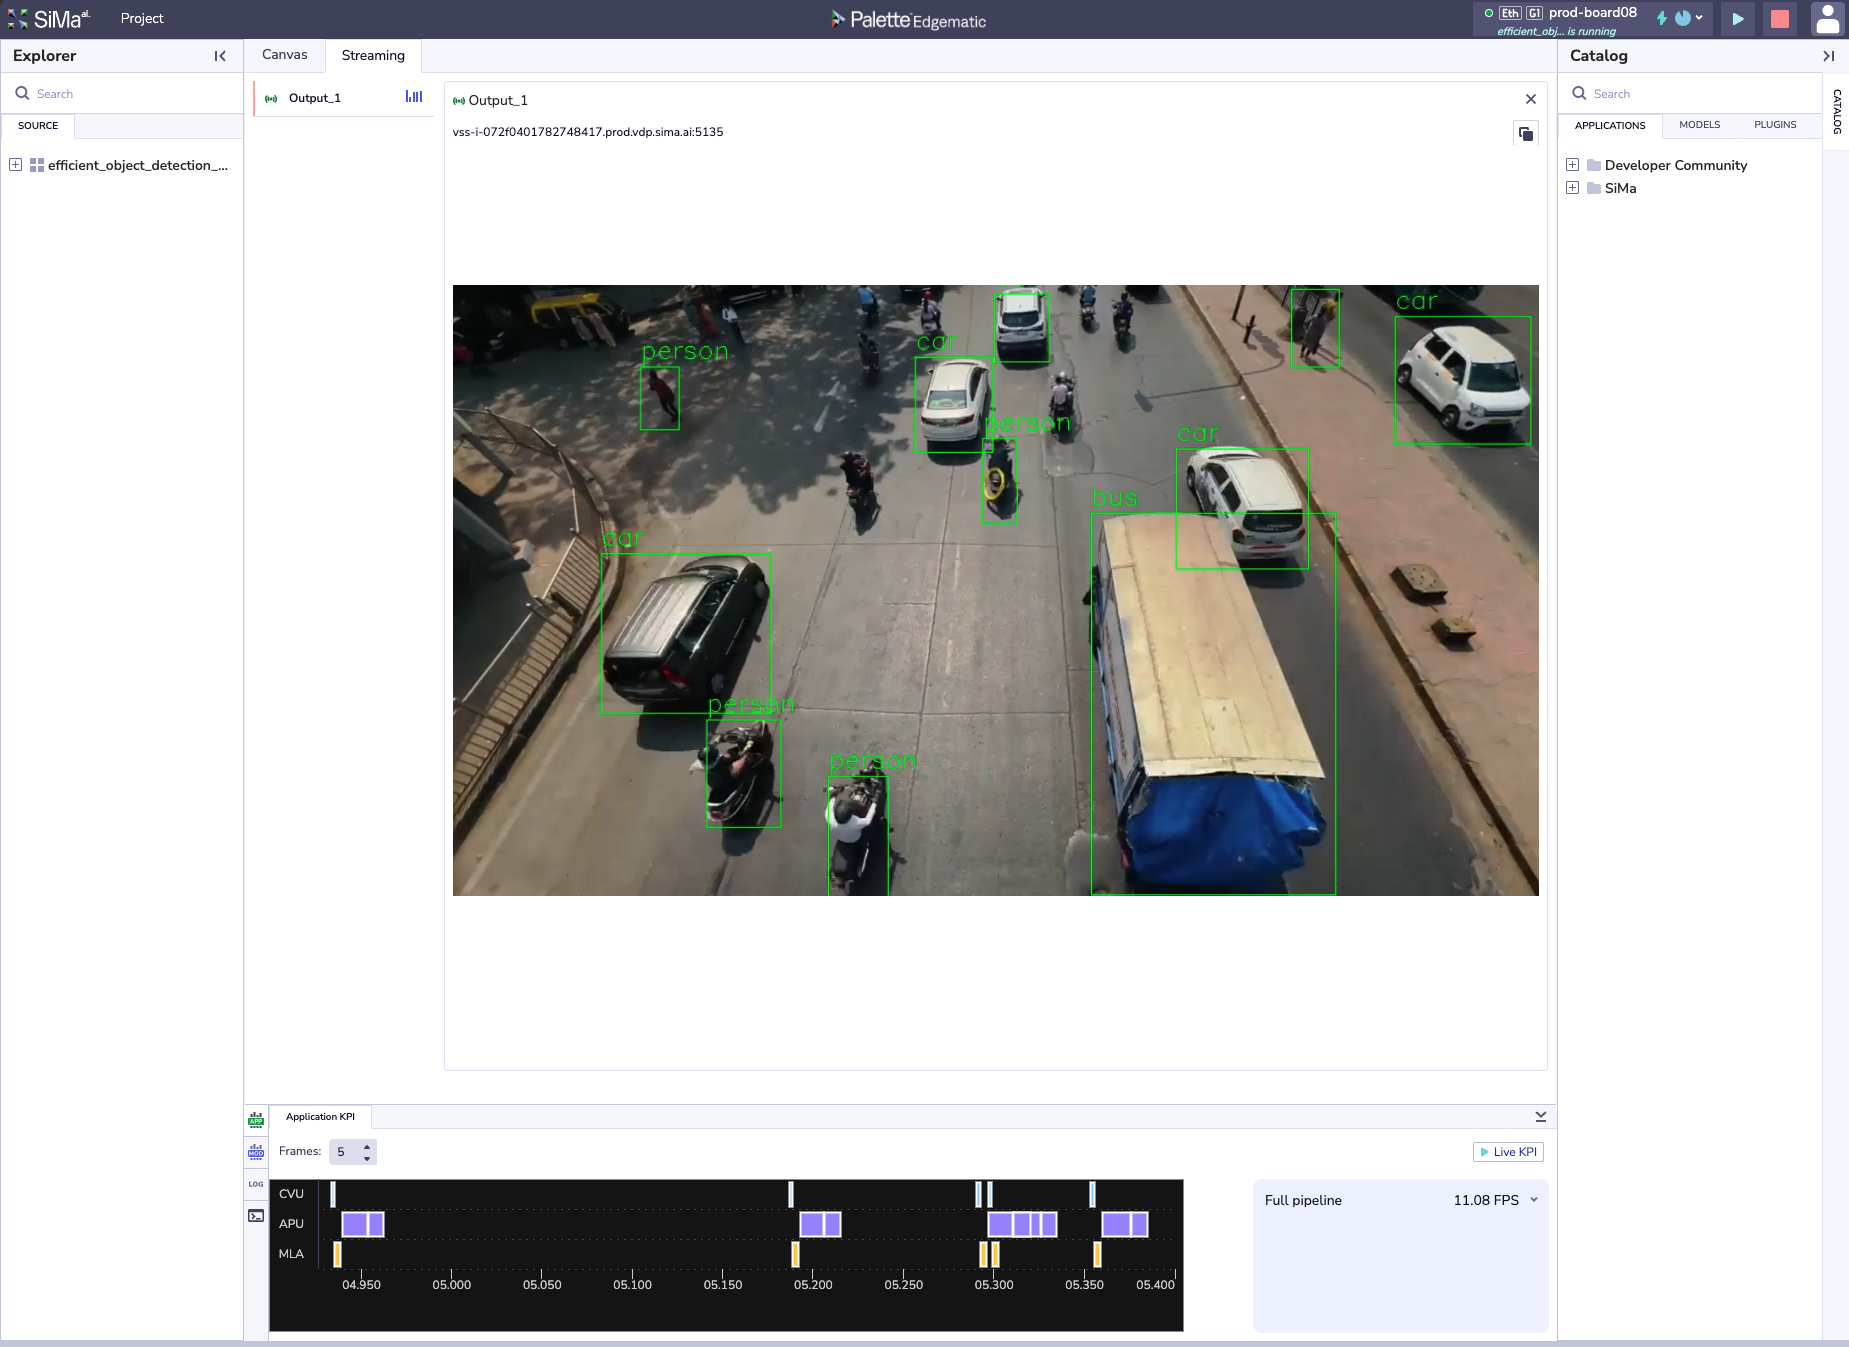
Application KPI
The Application KPI section displays multiple performance metrics. The center of the visualization window shows plugin latency across different processing units, where each color represents a specific processor:
Light blue: CVU (DSP EV74)
Purple: APU (CPU ARM A65)
Yellow: MLA (SiMa’a Machine Learning Accelerator)
Displayed metrics include:
Full Pipeline Throughput: Current pipeline performance in frames per second (FPS), typically limited by the input speed.
MLA Throughput: Maximum throughput achieved by the Machine Learning Accelerator for the pipeline.
APU Throughput: Maximum throughput achieved by the CPU ARM A65 for the pipeline.
CVU Throughput: Maximum throughput achieved by the DSP EV74 for the pipeline.
Model KPI
The Model KPI section provides detailed model performance information. The central panel displays model latency in microseconds (µs), while the right panel presents the following metrics:
Model Throughput: Current model performance in frames per second.
Efficiency: Model throughput divided by the Model Execution Power.
Model Execution Power: Calculated as the Board Running Power minus the Board Idle Power.
Board Running Power: Average total board power (in watts) while running the model over a 30-second interval.
Board Idle Power: Average total board power (in watts) before running the model.
Logs
The Logs section provides two types of logs: SYSTEM and DEVICE.
SYSTEM: Logs generated by the Edgematic SYSTEM, including compilation logs during application creation. These logs are useful for identifying code or configuration errors within different plugins.
DEVICE: Logs generated by the device after pipeline deployment. These include runtime errors, GStreamer deployment errors, and any log messages generated within custom plugin code.
Terminal
The Terminal section allows users to execute remote commands on the device.
Currently, the supported commands include:
pstop
These commands enable users to monitor running processes. Additional commands may be supported upon request.
The notification bell provides real-time visibility into all processes running on Edgematic, such as compilation, deployment, RPM package installation, KPI collection, and more.
Users can expand or minimize the notification list by clicking on the bell icon to view or hide the current processes.
Starter Examples
In this section, we aim to get you started and familiar with some of the capabilities of Edgematic. Each tab is designed to be a short introduction to a mainline feature, and is marked with the estimated time it should take to complete. You will also find references in each tab to more comprehensive documentation on the topic being covered.
Introduction
In this section, you will learn how to run a demo application that is preloaded in Edgematic’s interface. This is the fastest way to run a complete pipeline and better understand the capabilities of Edgematic and SiMa.ai MLSoC and MLSoC Modalix.
What you will learn
How to load an Edgematic demo application.
How to allocate a device for running the pipeline.
How to start, monitor, and stop a running application.
How to view live inference results.
For more detailed information, please refer to:
Application Catalog page, which provides descriptions of all the demos.
GStreamer Pipelines section of the Edgematic Features page.
Steps
From the Edgematic Projects > Demo page, select efficient_object_detection.
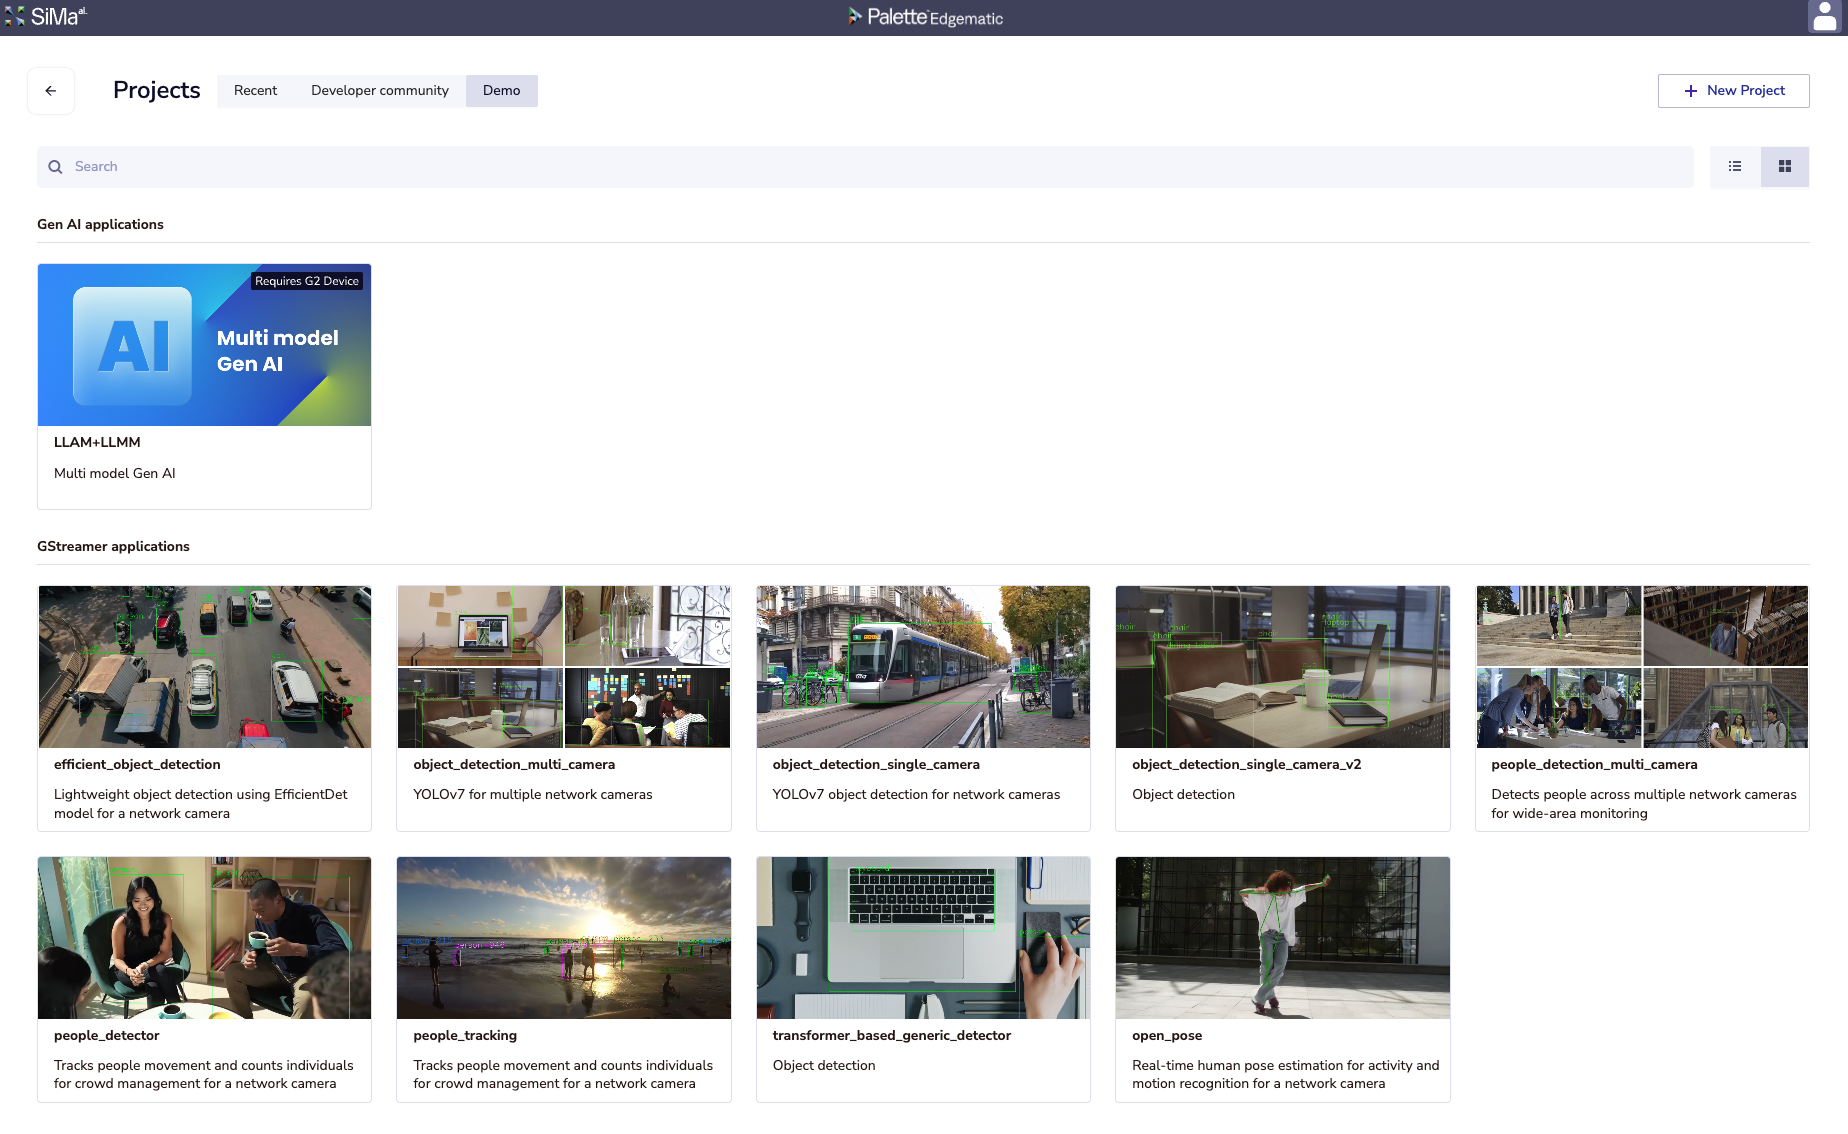
Wait for the application to load. It should look something like this:
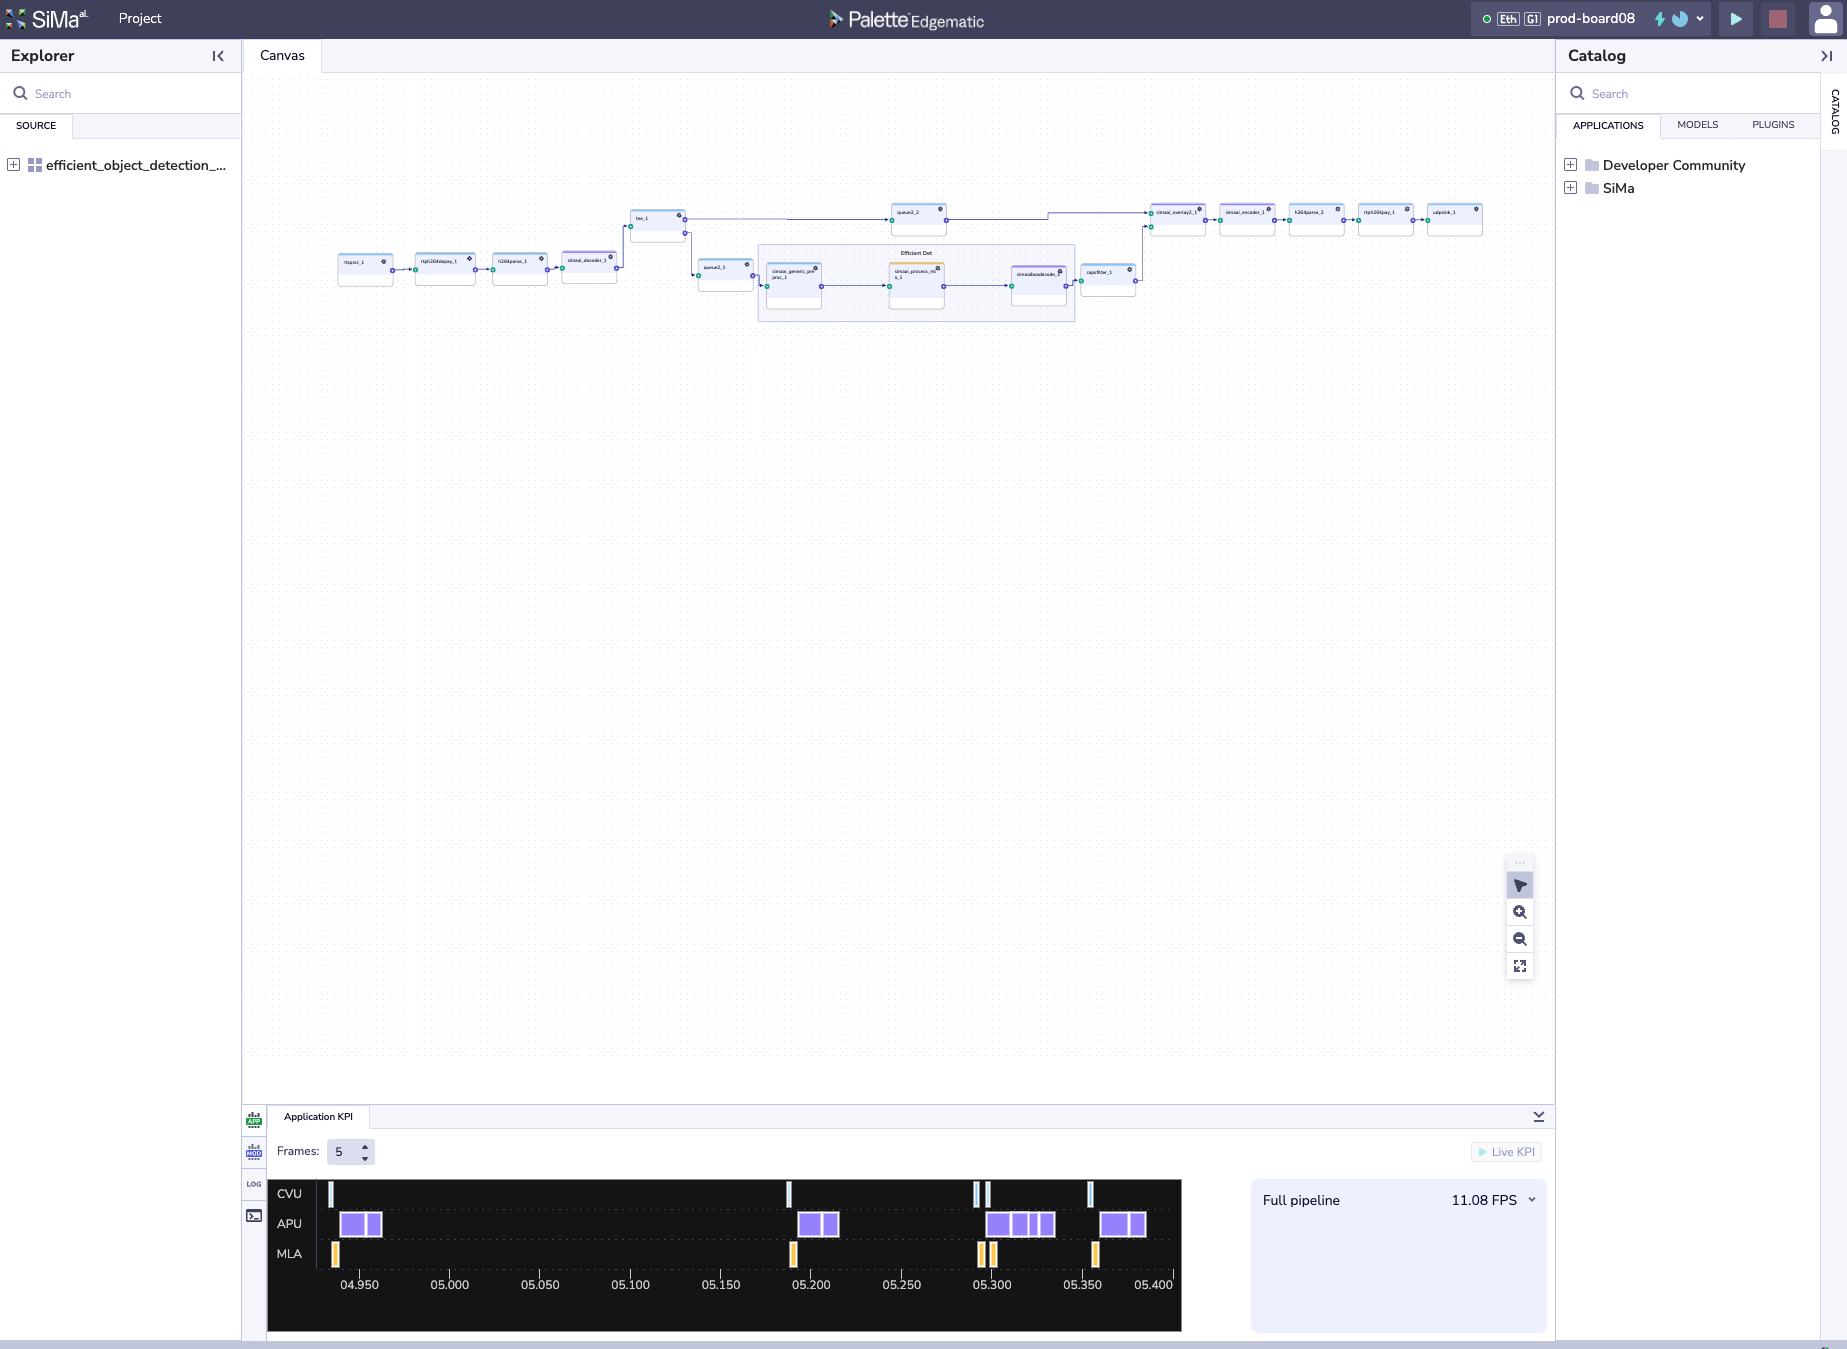
Ensure you have a device assigned. If you do not, press on Request Device on the top right, and wait for a device to be assigned. Once it does, it should look something like this:
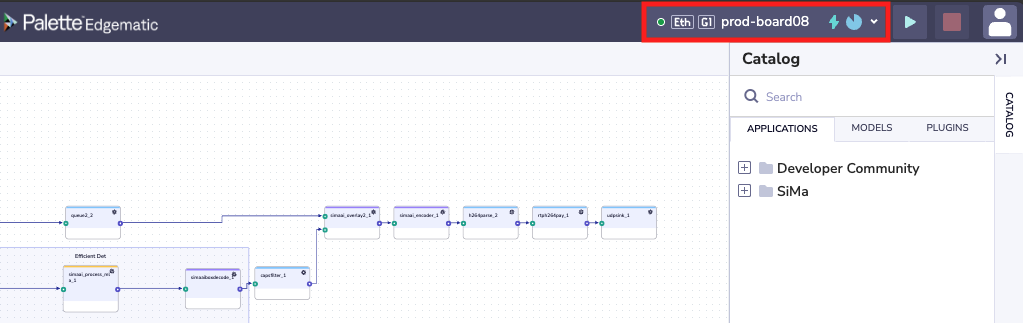
Click on the green run button (
 ) on the top right of the menu bar. You will see the
Task Manager pop-up on the bottom right and show the progress of the pipeline build and deployment.
) on the top right of the menu bar. You will see the
Task Manager pop-up on the bottom right and show the progress of the pipeline build and deployment.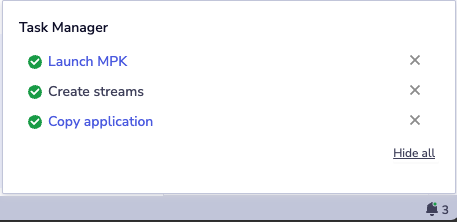
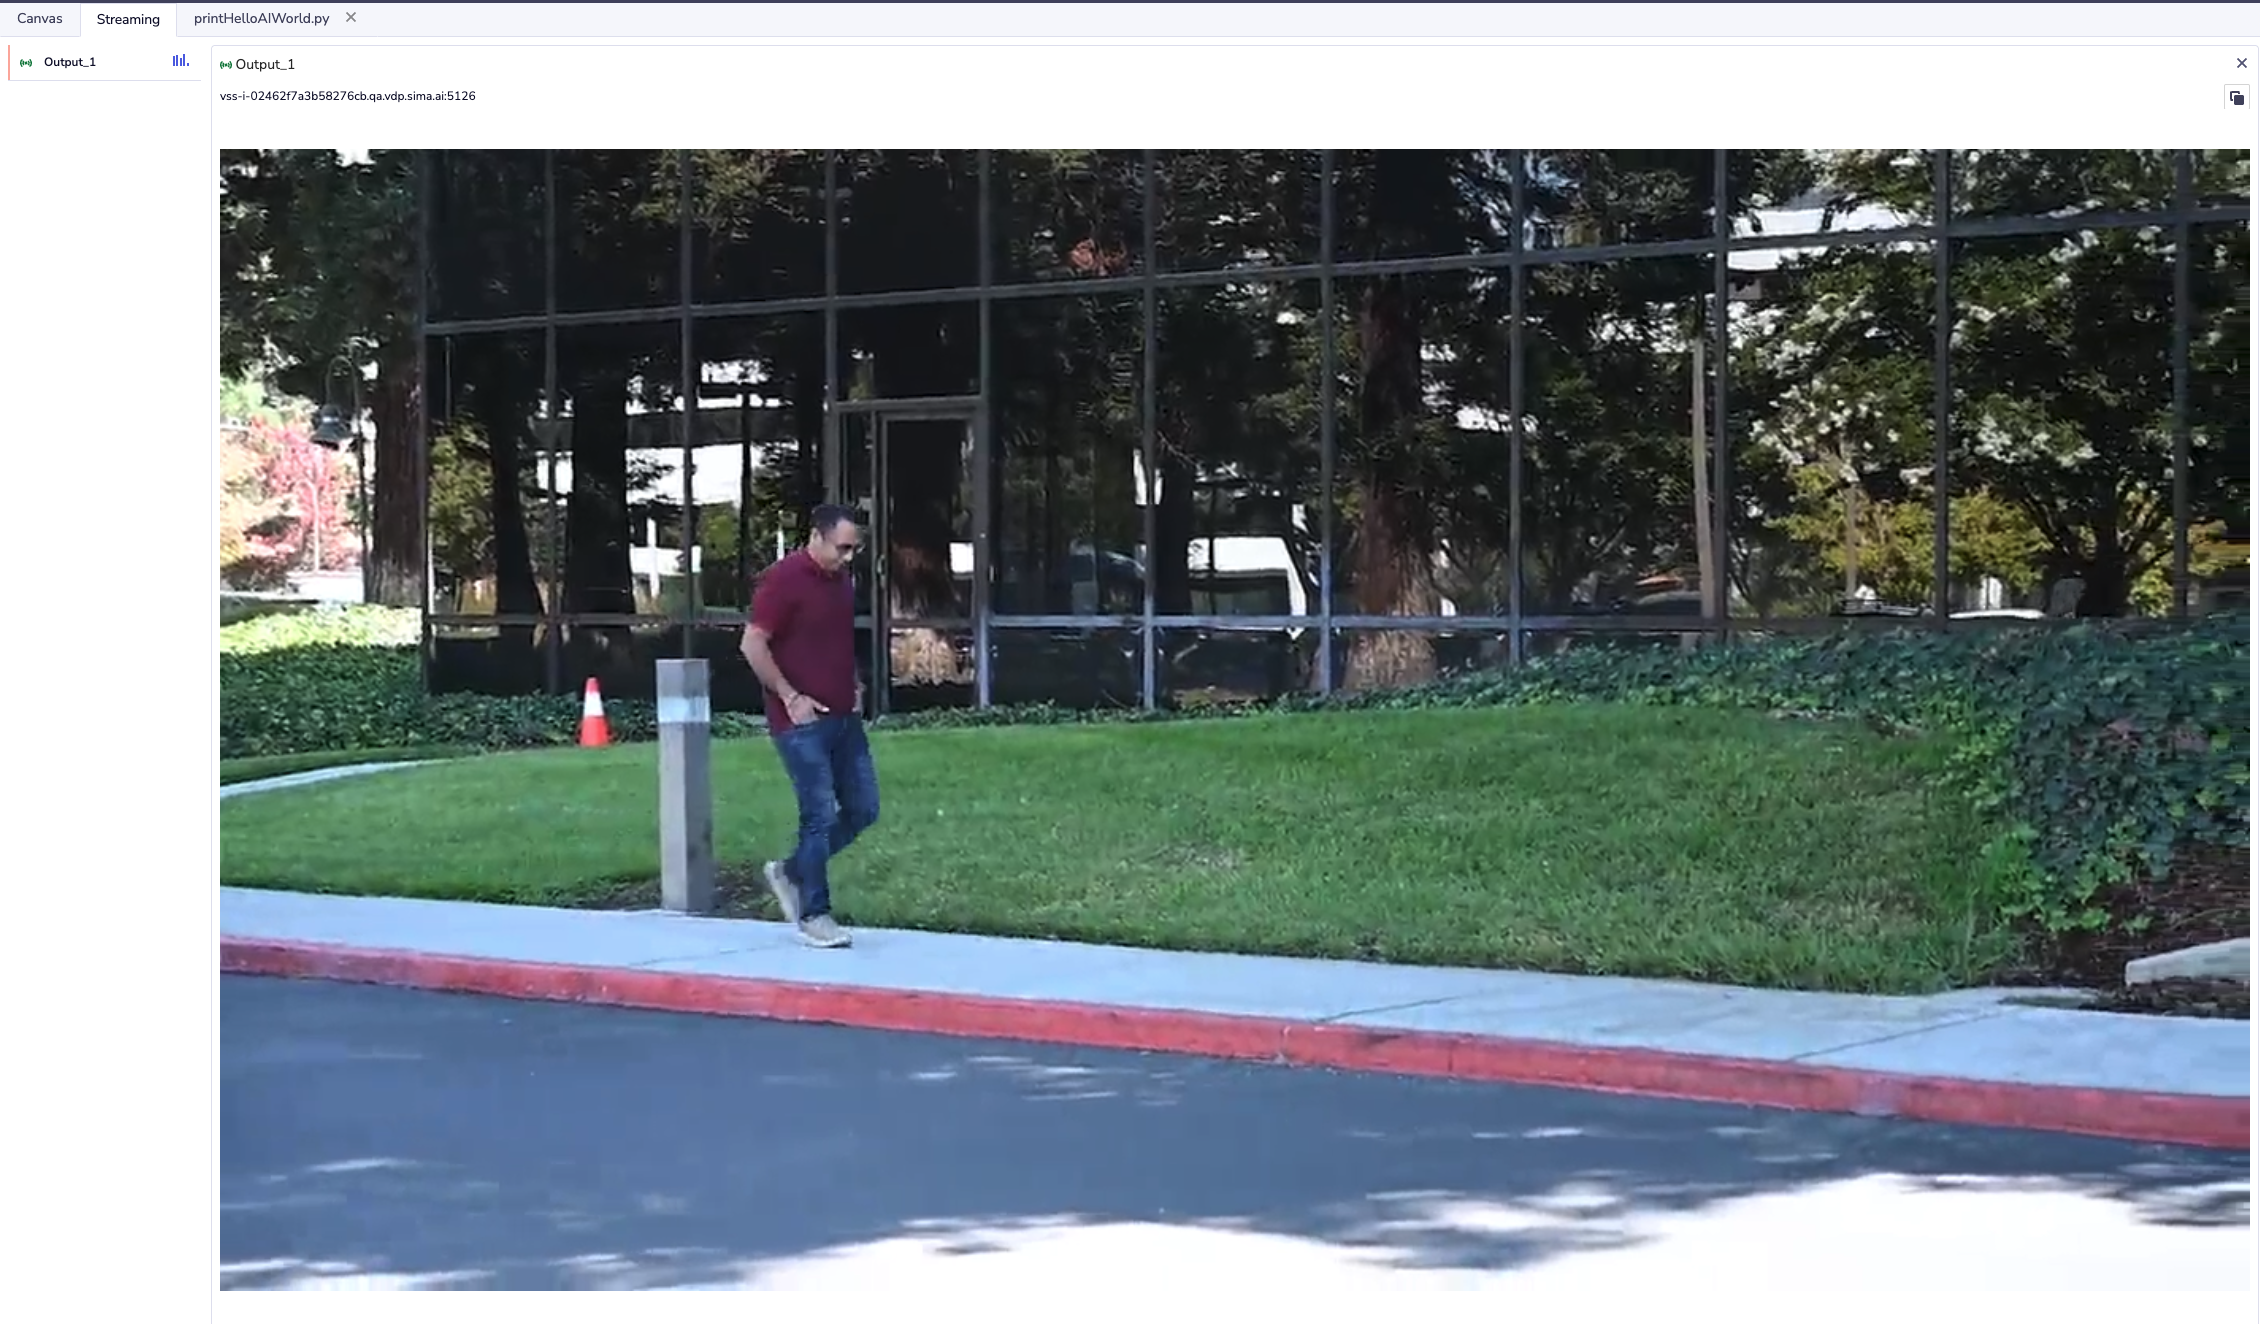
Lastly you should see the video of the inference result come up on a tab called Streaming.
To stop, click on the red stop button (
 ) on the top right of the menu bar.
Nicely done! You have run your first application on SiMa.ai HW.
Note
To go back to the main projects page, navigate to in the Project Menu button on the top left of the UI.
Introduction
In this section, you’ll learn how to measure Key Performance Indicators (KPIs) for a model from Edgematic’s Model Catalog (). KPI measurement allows you to quickly evaluate model performance (e.g., FPS, FPS/W) directly on SiMa.ai hardware.
What you will learn
How to create a new project for KPI testing.
How to locate and select a model from the Model Catalog.
How to run KPI measurement on a SiMa.ai device.
How to view and interpret KPI results.
For more detailed information, please refer to:
KPI Measurement > Viewing Your Model’s KPI section of the Edgematic Features page.
Model Catalog for information on the models provided in the catalog.
Steps
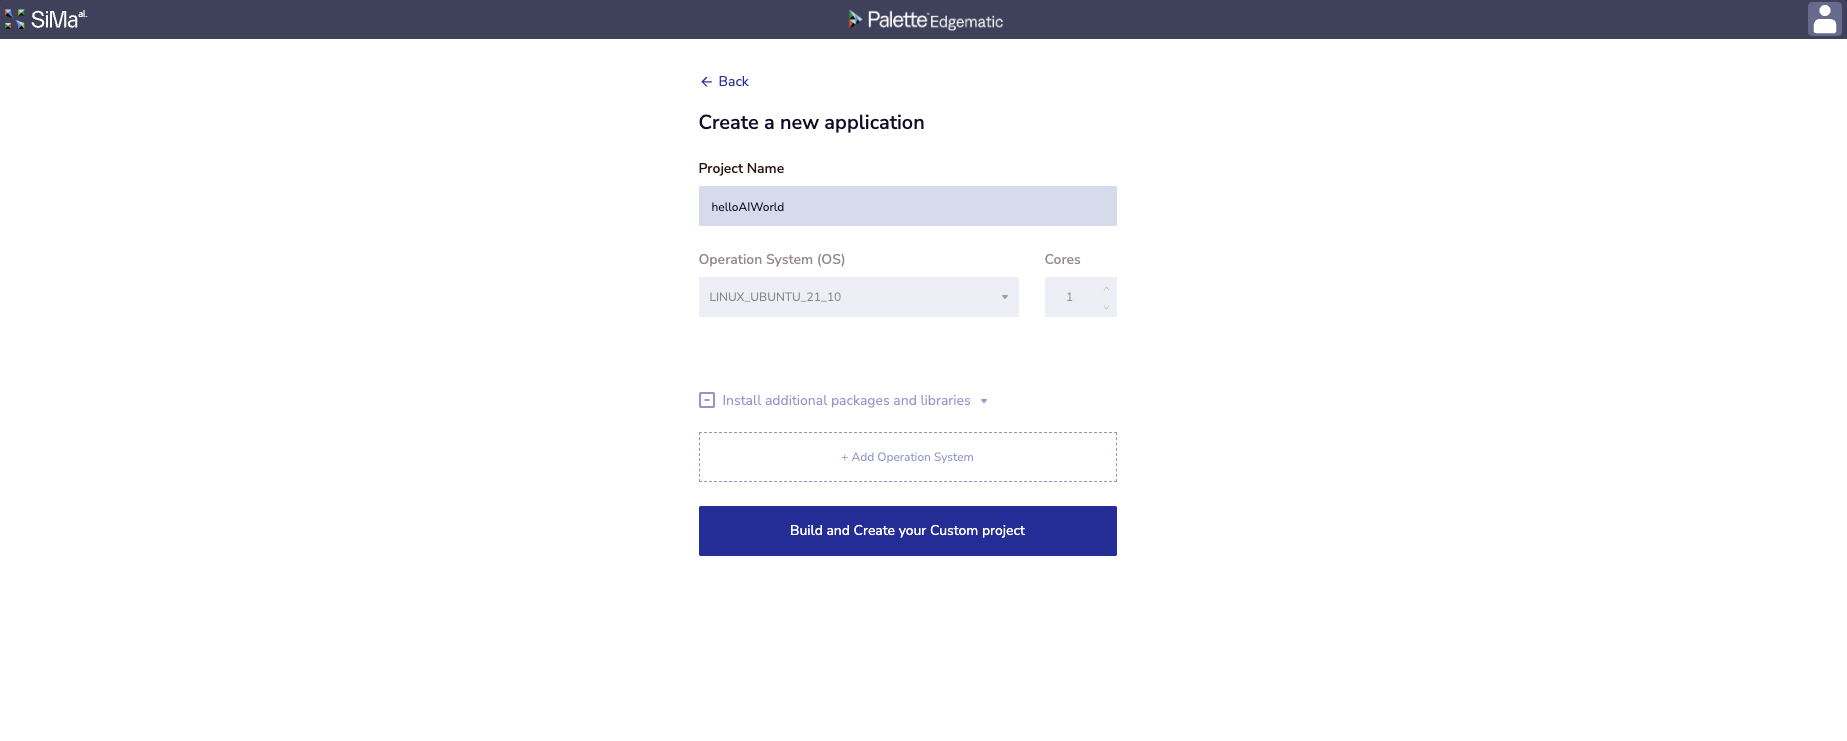
From the Edgematic Projects page, select + New Project on the top right.
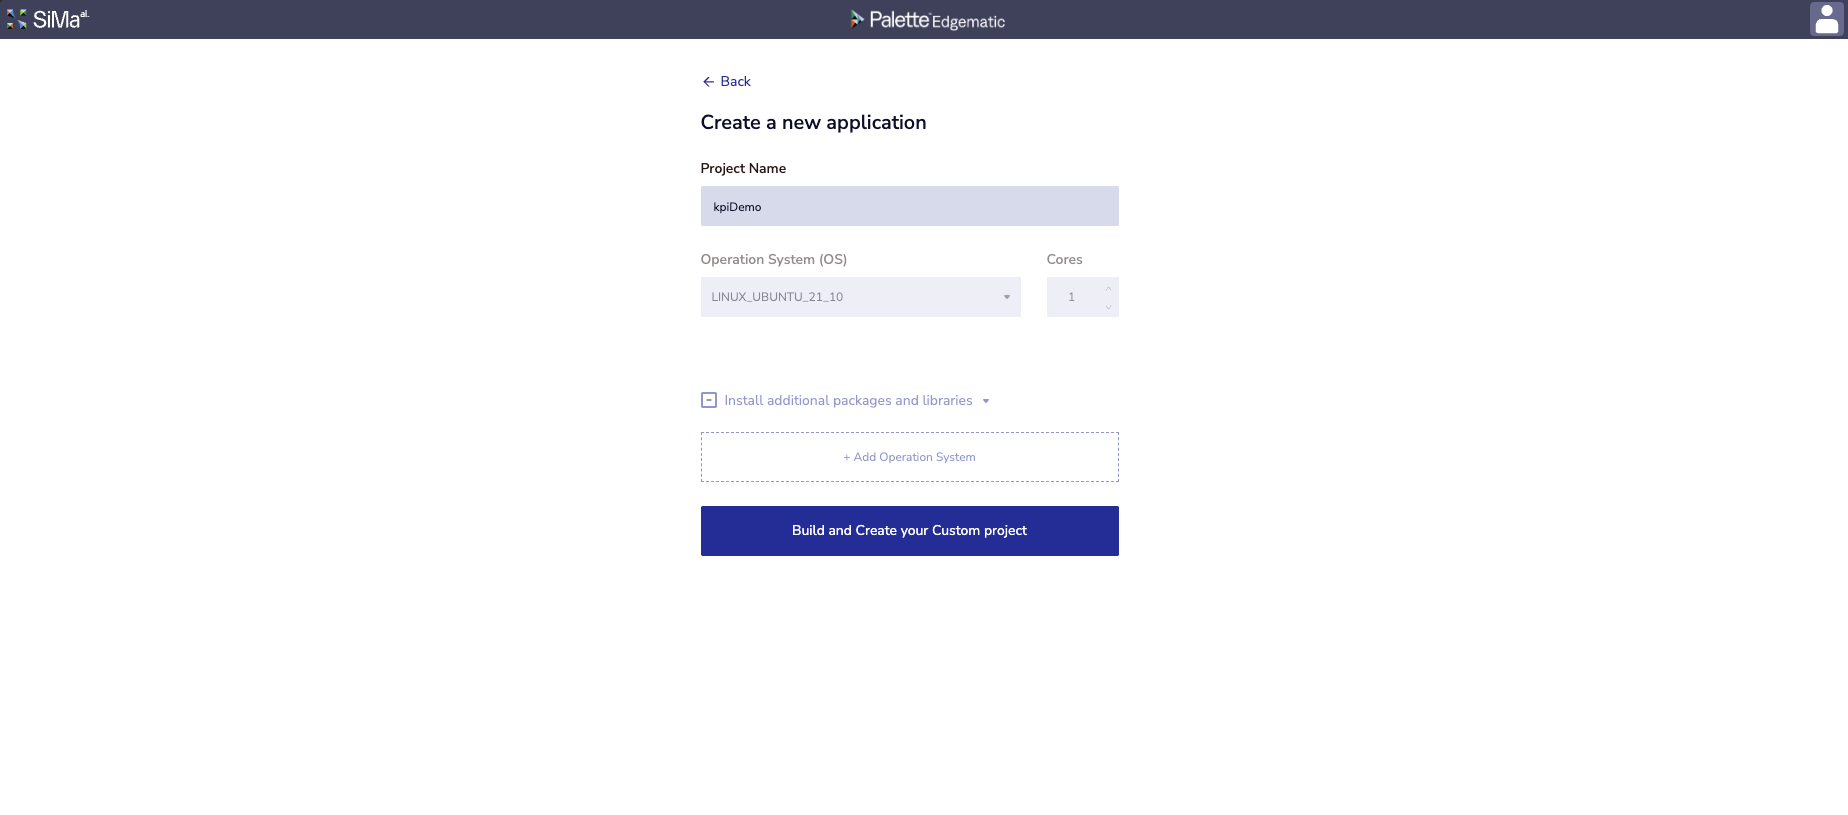
Name the project anything you’d like, for example: kpiDemo and press on the button. Build and Create your Custom project
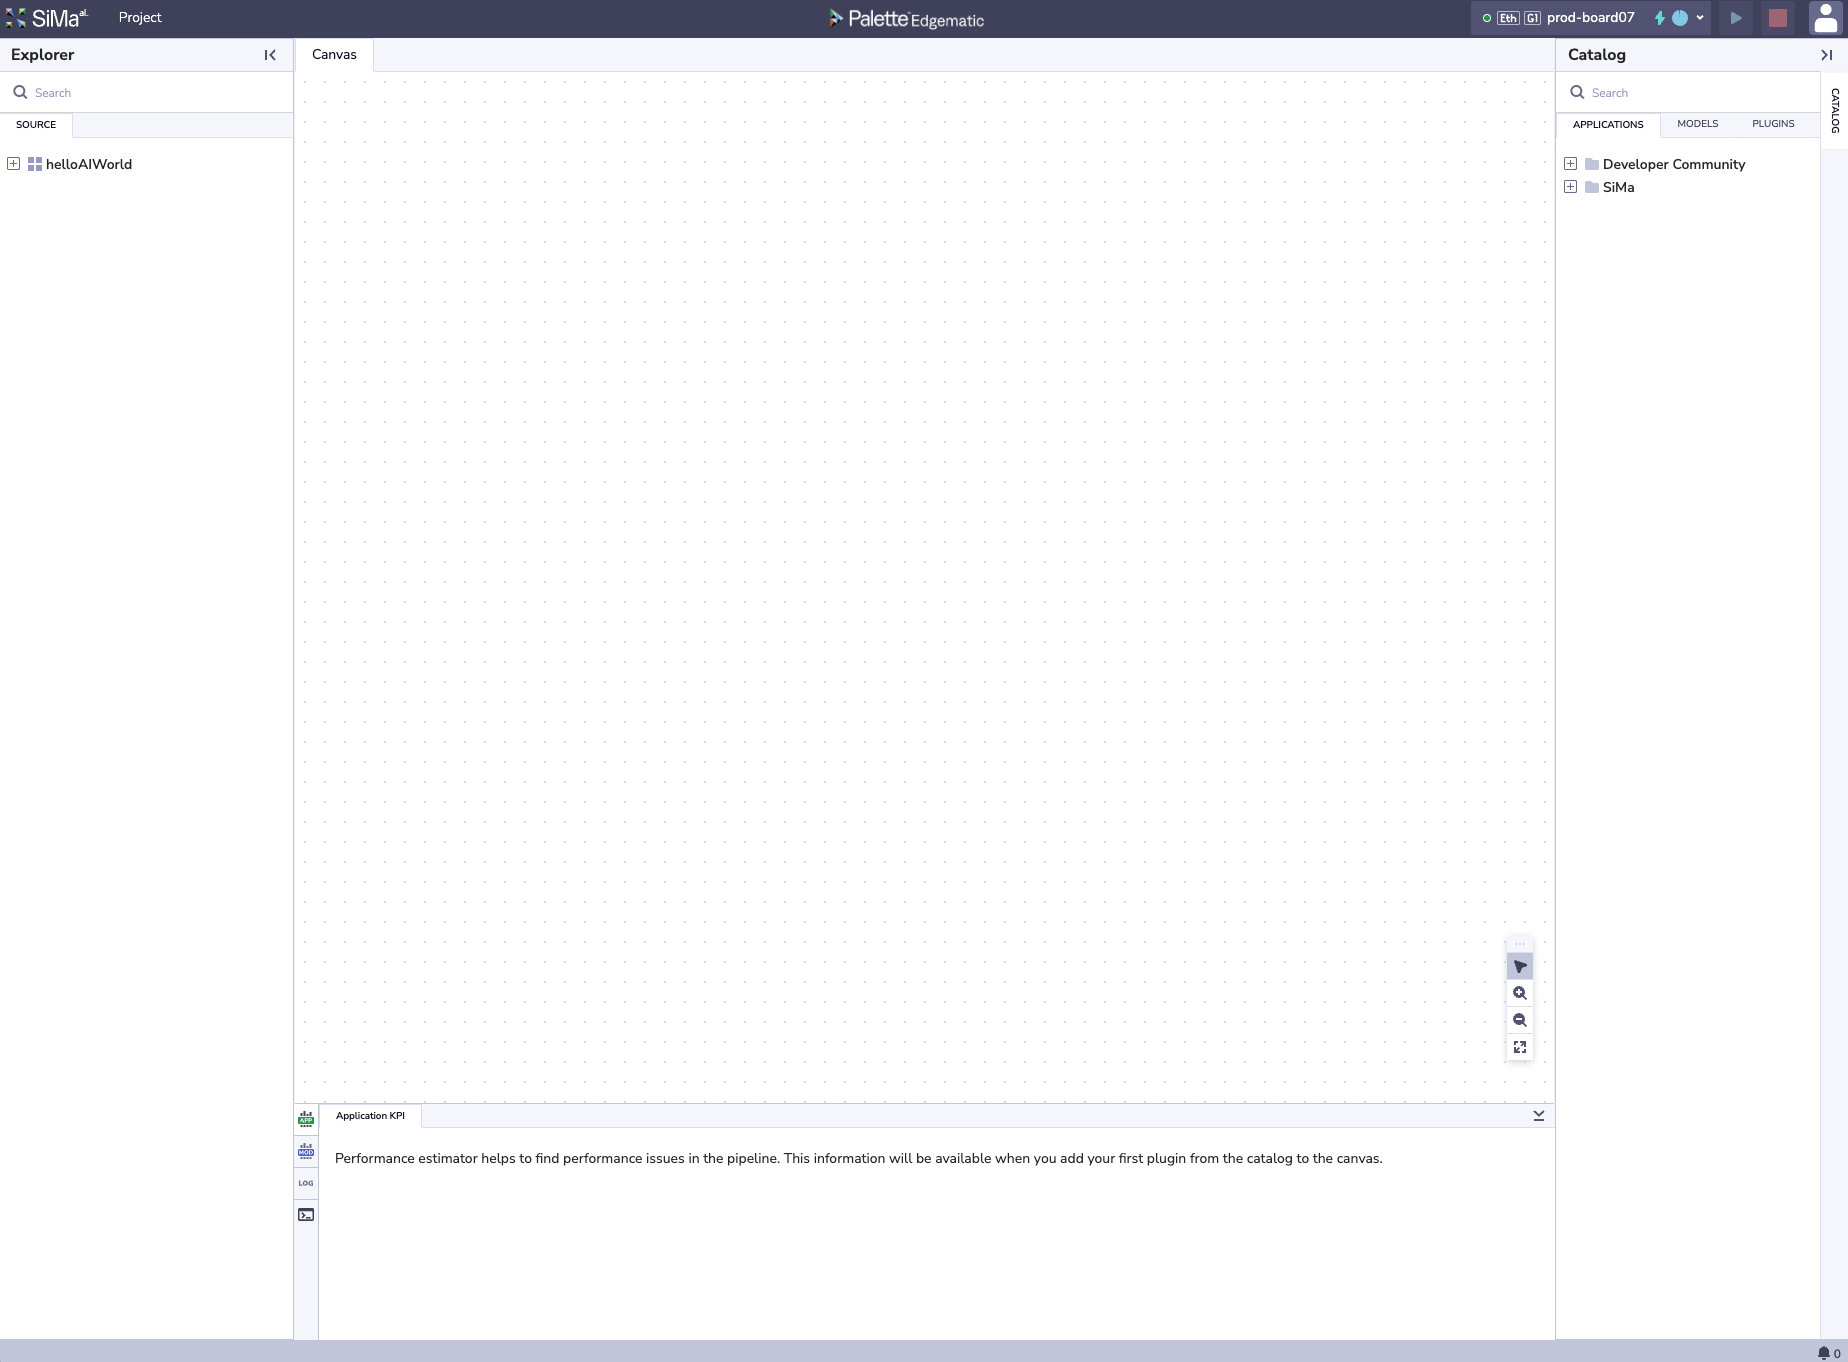
Upon project creation, you should see a blank canvas:
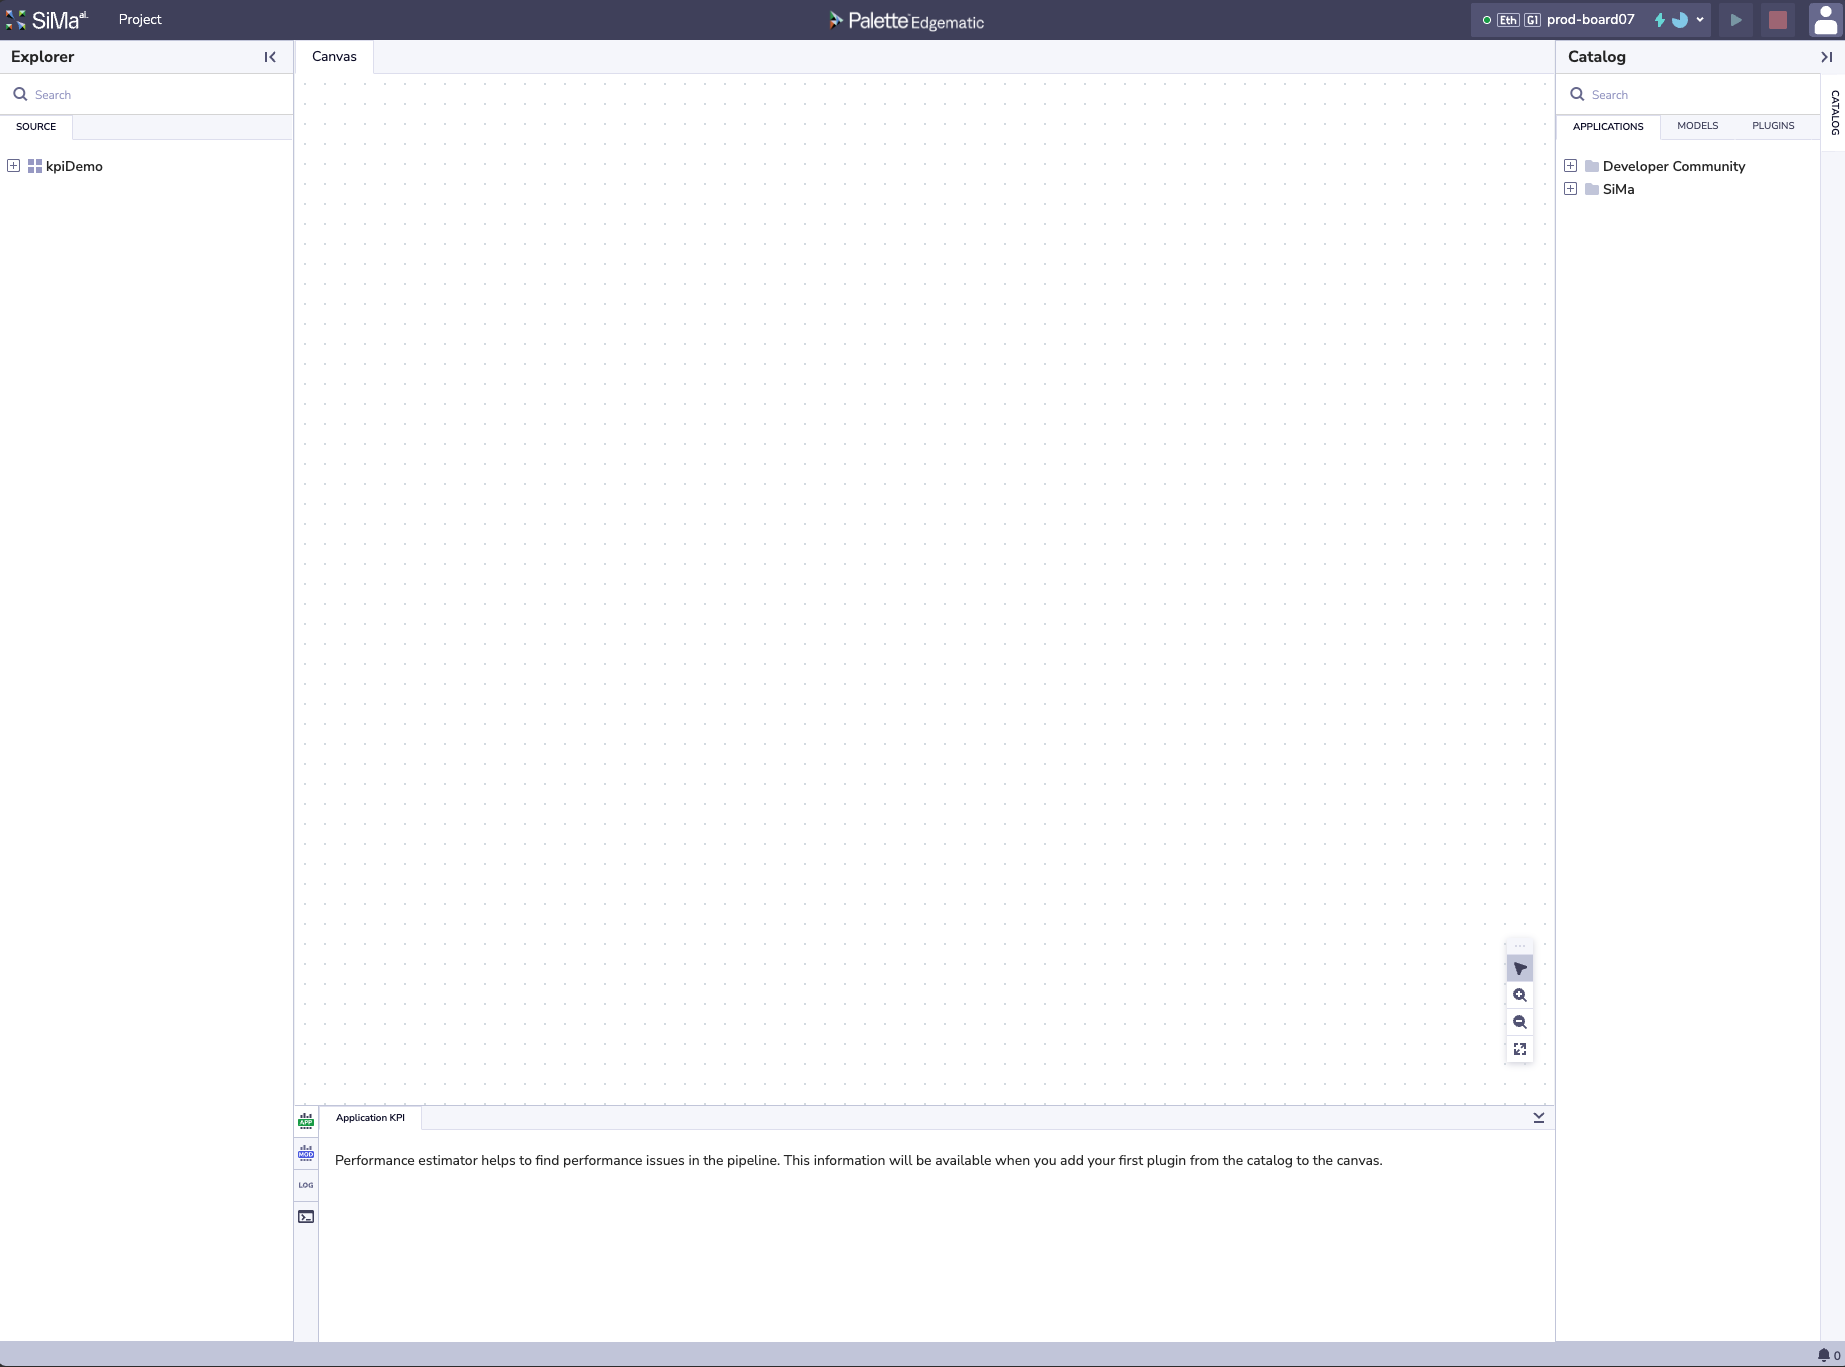
Ensure you have a device assigned. If you do not, press on Request Device on the top right, and wait for a device to be assigned. Once it does, it should look something like this:
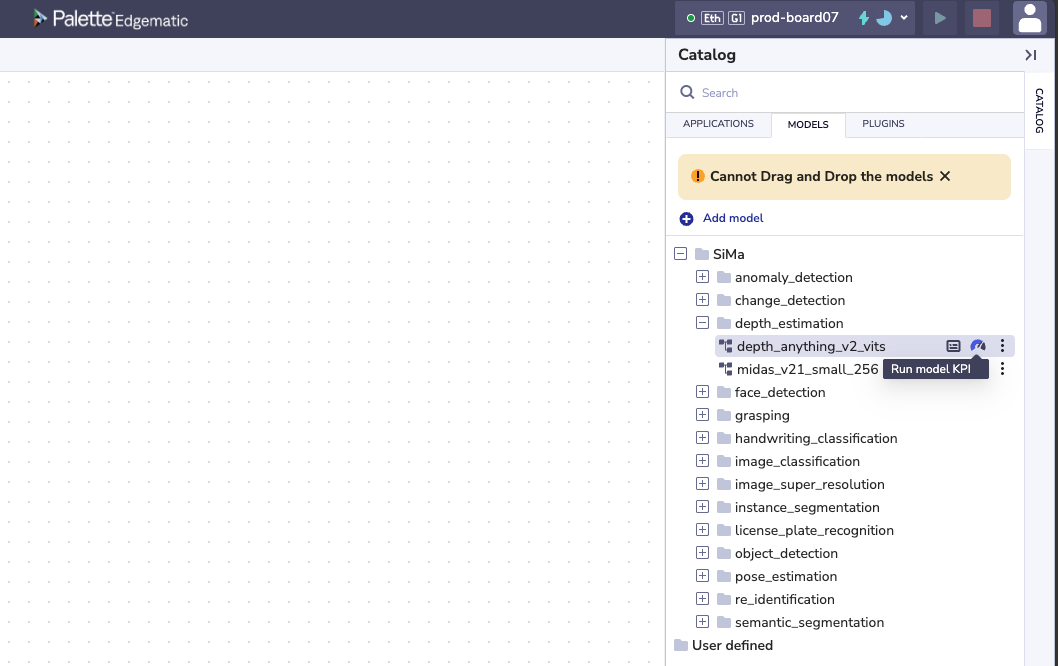
On the Catalog on the right hand side, click on the MODELS tab.
Expand the SiMa folder. Under this folder, expand the depth_estimation folder.
Click on the Run model KPI button next to the model depth_anything_v2_vits (
 )
)
The task manager on the bottom right. To see the task manager, click on the notification bell (
 ) on the bottom right of the page
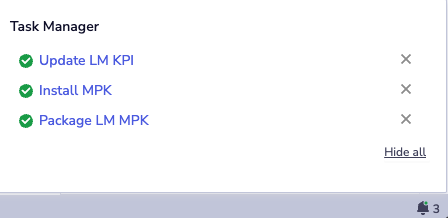
After the model has fully run, you should see the KPIs in the Visualization Toggle section of Edgematic.
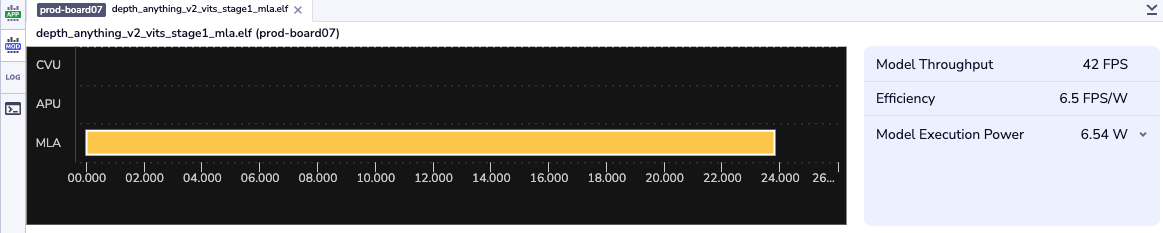
Nicely done! You have run your first model KPI collection using SiMa.ai HW.
Note
To go back to the main projects page, navigate to in the Project Menu button on the top left of the UI.
Important
Must be on a paid version of edgematic to try out this feature.
Introduction
This section walks you through creating a minimal custom Edgematic application from scratch.
You’ll build a pipeline that accepts video frames over Ethernet and prints a message for each incoming
frame ('Hello AI World!') — a lightweight way to confirm that your pipeline, plugin, and device
connection are all working.
The goal is to introduce the key parts of Edgematic application building:
Use an Ethernet plugin group for input () with a video as the input stream.
Insert a custom plugin (Python or C++), and insert a print line for every frame that is received.
Use an Ethernet plugin group for output ().
After completing these steps, you will have a working template you can extend to real applications, which will be covered in greater detail in later sections.
What you will learn
How to create a new Edgematic project from the dashboard.
How to add Ethernet input and output plugins to a pipeline.
How to create and edit a custom Python or C++ plugin.
How to connect plugins on the canvas and run the pipeline.
How to view logs from your plugin running on a SiMa.ai device.
For more detailed information on application building, please refer to:
The GStreamer Plugins section of the Edgematic Features page.
For
Pythoncustom plugins refer toFor
C++custom plugins refer toThe Building Applications page.
Steps
From the Edgematic Projects page, select + New Project on the top right.
Name the project anything you’d like, for example: helloAIWorldDemo and press on the button Build and Create your Custom project
Upon project creation, you should see a blank canvas:
Ensure you have a device assigned. If you do not, press on Request Device on the top right, and wait for a device to be assigned. Once it does, it should look something like this:
On the Catalog section on the right hand side, click on the PLUGINS tab.
Expand the Plugin Group folder and locate the ethernet_input plugin.
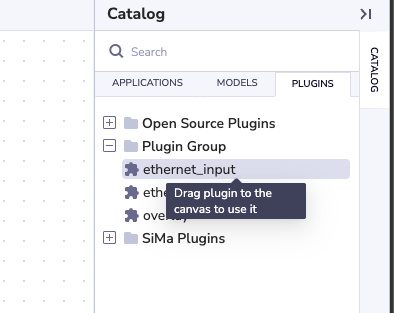
From here, drag and drop the ethernet_input plugin into the canvas.
Locate the SOURCE tab under the Project Explorer on the left hand side.
Right-click the
helloAIWorldproject, and select Create custom plugin.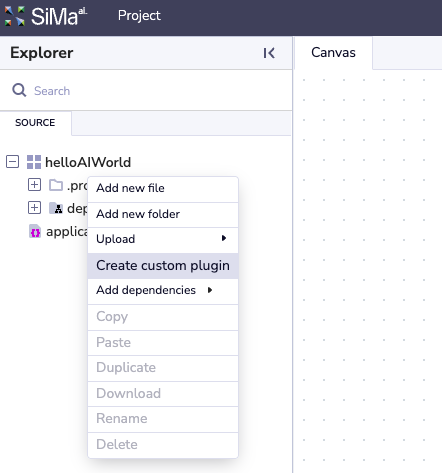
Next are language specific instructions for the custom plugins, please choose one:
In the Plugin name field, name your plugin, for example:
printHelloAIWorld. EnsurePythonis selected under Plugin type and input1in the Input/Output nodes field. This tells Edgematic that we will only be receiving one input. Finally, select Save.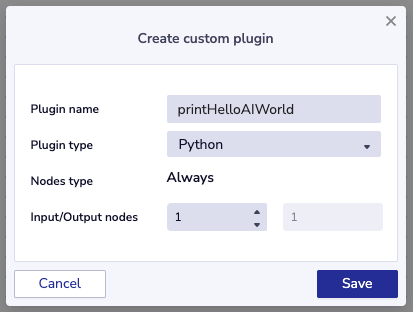
The plugin should be added to your canvas automatically. Drag it to the right of the Ethernet_input plugin and select the connect C tool (
 )
on the canvas. Next, connect the two plugins by pressing on the blue/purple output of
the ethernet_input plugin and performing a second click on the green input of the
newly created simaai_printHelloAIWorld plugin.
)
on the canvas. Next, connect the two plugins by pressing on the blue/purple output of
the ethernet_input plugin and performing a second click on the green input of the
newly created simaai_printHelloAIWorld plugin.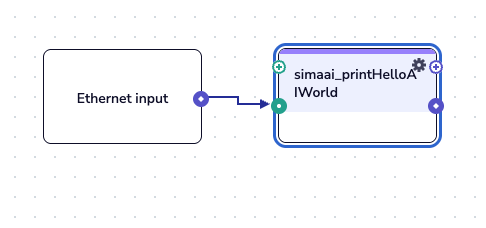
Locate the SOURCE tab under the Project Explorer on the left hand side. Under you should see the source code for the printHelloAIWorld plugin. Open the file named
printHelloAIWorld.py.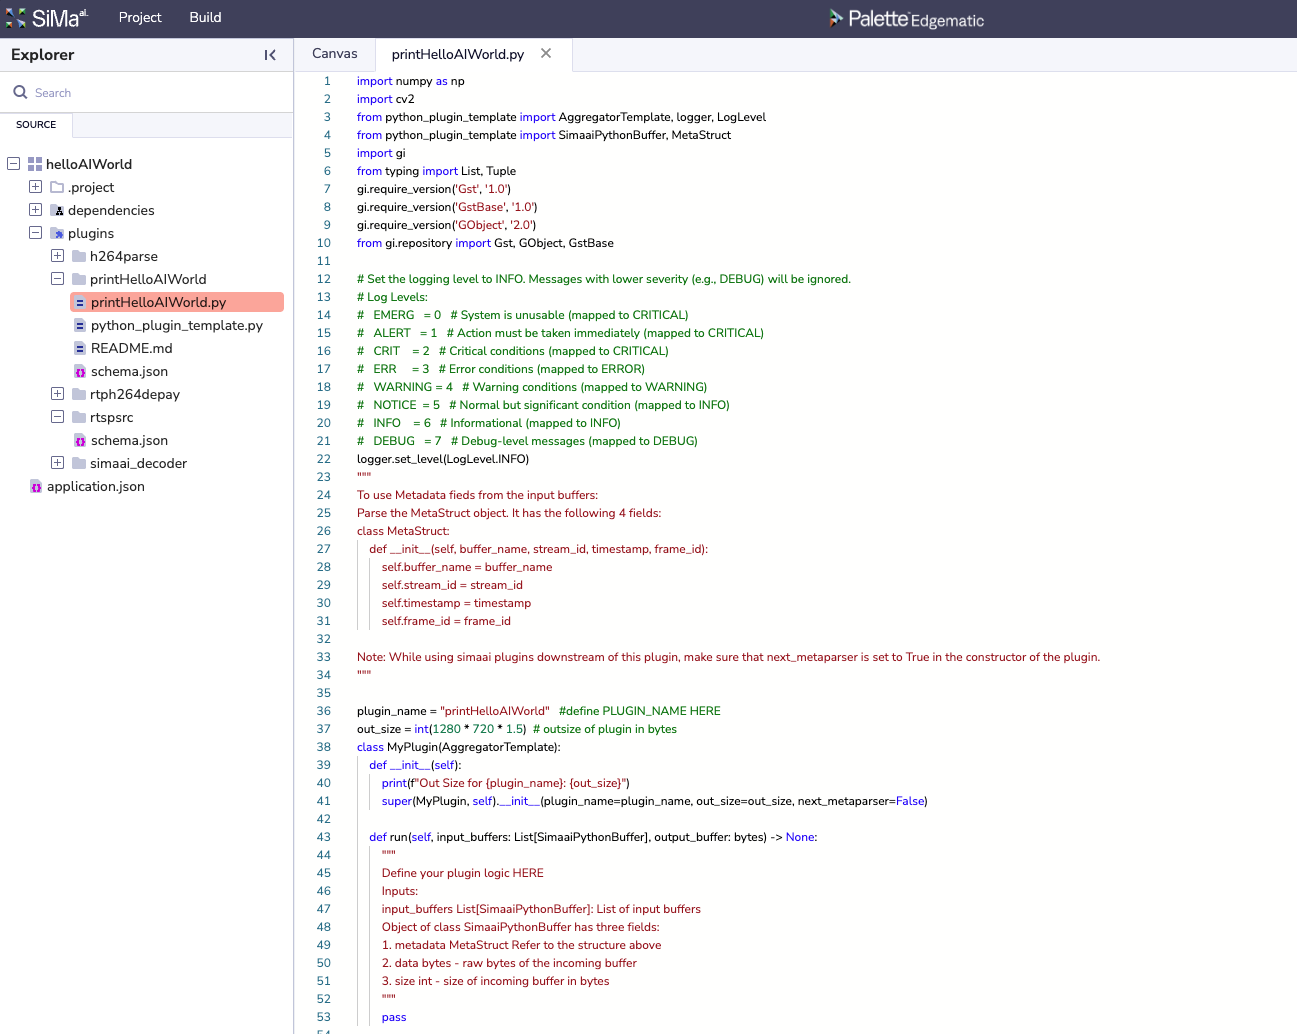
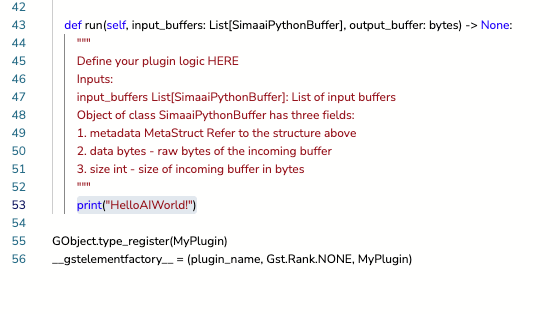
Find the function
def run(...). The function body should contain a simplepasswithin. Replace it with:print("HelloAIWorld!")
Save by pressing Ctrl+s on Windows/Linux or command+s on MacOS. Go back to the Canvas tab.
In the Plugin name field, name your plugin, for example:
printHelloAIWorld. EnsureC++is selected under Plugin type and input1in the Input/Output nodes field. This tells Edgematic that we will only be receiving one input. Finally, select Save.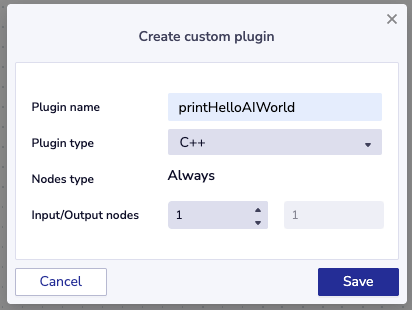
The plugin should be added to your canvas automatically. Drag it to the right of the Ethernet_input plugin and select the connect C tool (
)
on the canvas. Next, connect the two plugins by pressing on the blue/purple output
of the ethernet_input plugin and performing a second click on the green input of
the newly created simaai_printHelloAIWorld plugin.
Locate the SOURCE tab under the Project Explorer on the left hand side. Under you should see the source code for the printHelloAIWorld plugin. Open the file named
payload.cpp.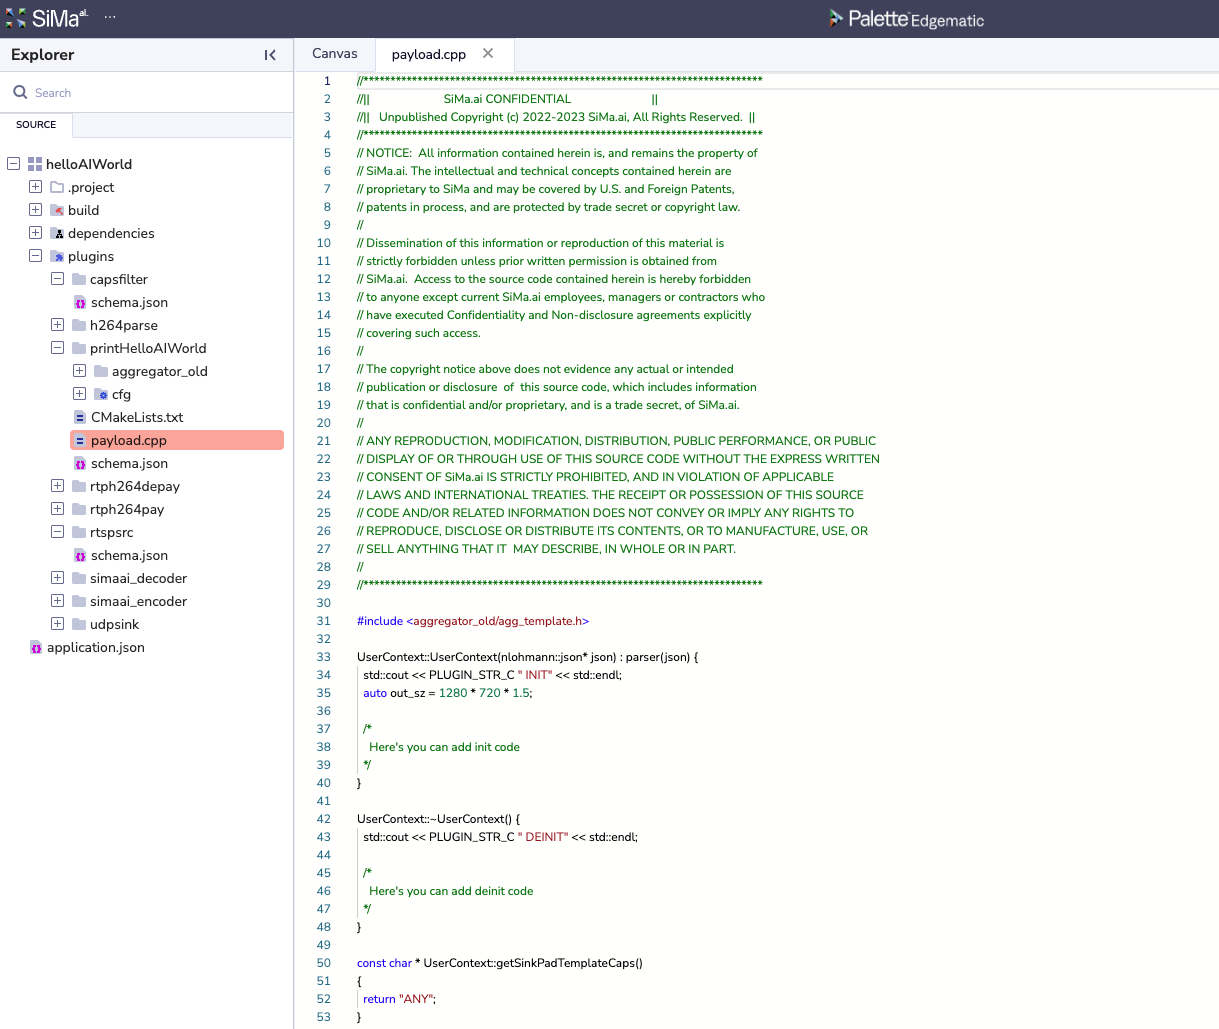
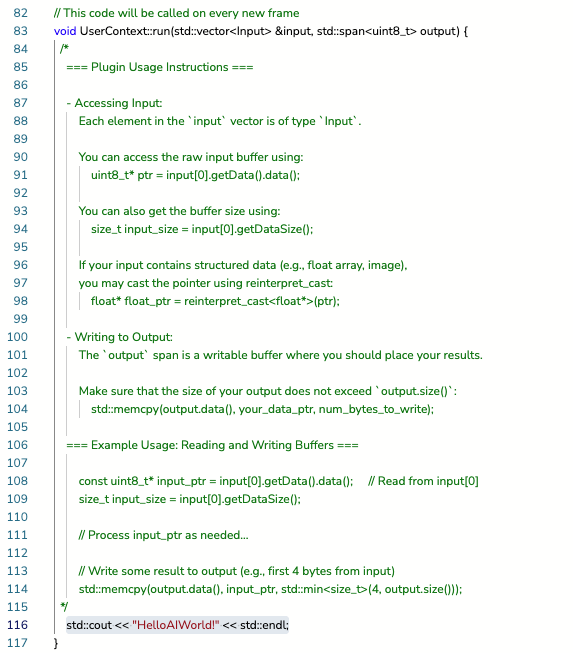
Within the
UserContext::runfunction add the following line of code:std::cout << "HelloAIWorld!" << std::endl;
Save by pressing Ctrl+s on Windows/Linux or command+s on MacOS. Go back to the Canvas tab.
On the Catalog on the right hand side, click on the tab.
Expand the Plugin Group folder and locate the ethernet_output plugin. Drag and drop the ethernet_output plugin into the canvas.
If not already selected, select connect C tool (
) the canvas. Next,
connect the two plugins by pressing on the blue/purple output of the
simaai_printHelloAIWorld plugin and performing a second click on the green input of the
newly created ethernet_output plugin.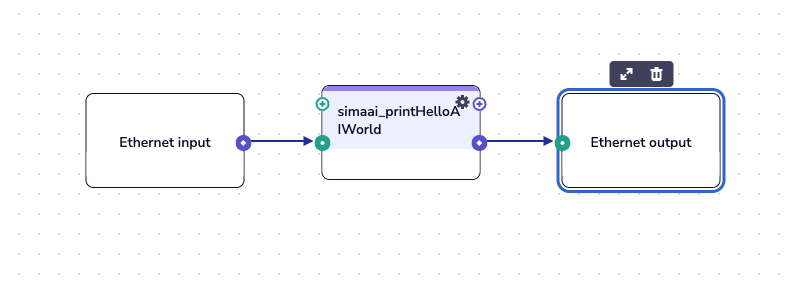
Click on the green run button (
) on the top right of the menu bar. You will see the
Task Manager pop-up on the botom right and show the progress of the pipeline build and
deployment.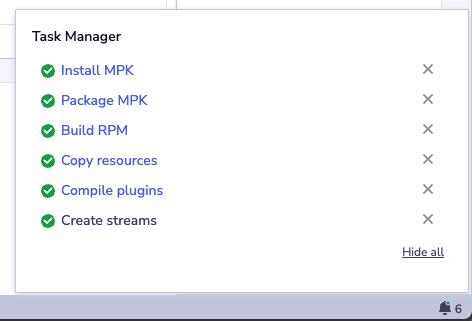
Navigate to the Visualization Toggle section of the screen. Select LOG on the left hand side buttons. Next select DEVICE on the tabs of the same section.
Here you should see logs printing out your custom code.
Note
In this sample, we will not be able to see the video, as the frames are not being forwarded in the custom plugin, more on this in later sections.
To stop, click on the red stop button (
) on the top right of the menu bar.Nicely done! You have run your first application with a custom plugin using SiMa.ai HW.
Introduction
In this section, you’ll extend the previous example by adding code to draw directly on the incoming frames from the ethernet_in plugin. This will give you hands-on practice with reading and modifying buffers inside a custom plugin.
By the end, you’ll know how to access frame data, make in-place changes, and output the altered frames through your pipeline.
What you will learn
How to access frame buffers from a custom plugin.
How to copy the frame buffer to the next plugin in the pipeline.
Steps
Relocate the source code for the printHelloAIWorld plugin in a file named
printHelloAIWorld.py. Double click on it to open up the source code.In the
runfunction, below theprintline and add the following code:input_data = input_buffers[0].data # access the input buffer bytes length = min(len(output_buffer), len(input_data)) # determine amount of bytes to copy output_buffer[:length] = input_data[:length] # copy length amount of bytes
Click on the green run button (
) on the top right of the menu bar.
Relocate the source code for the printHelloAIWorld plugin in a file named
payload.cpp. Double click on it to open up the source code.In the
runfunction, below theprintline and add the following code:// Read from the first input buffer const uint8_t* input_ptr = input[0].getData().data(); size_t input_size = input[0].getDataSize(); // Determine how many bytes to copy size_t length = std::min(input_size, output.size()); // Copy from input to output std::memcpy(output.data(), input_ptr, length);
Click on the green run button (
) on the top right of the menu bar.
You should see the video playing and the printed output on the device log.
To stop, click on the red stop button () on the top right of the menu bar.
Note
In this example, we copied the incoming frame to the output buffer so we could visualize the video. Here’s what’s happening under the hood:
The Ethernet input and Ethernet output plugins wrap lower-level elements. If you expand them (pink button in the figure below), you’ll see the internal pipeline. For Ethernet output, it looks like this:
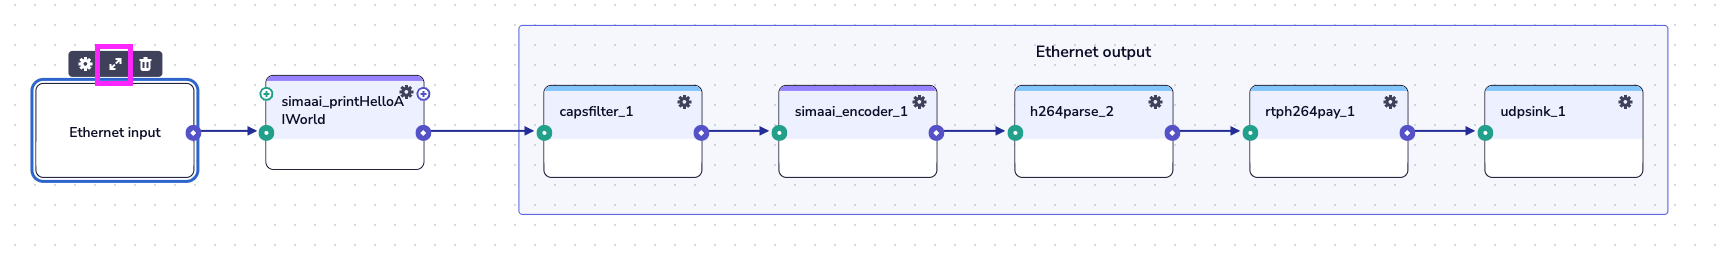
The output of Ethernet input is copied by our custom plugin, then passed through a caps filter, then into the encoder, H.264 parser/payload, and finally to a UDP sink for display.
To check what frame format is required, navigate to and inspect the
caps (Optional)field in the GENERAL tab:video/x-raw,format=NV12,width=1280,height=720,framerate=30/1
Since SiMa.ai’s Allegro Decoder/Encoder both output and expect NV12 as input, we can safely copy the buffer directly from Ethernet input to Ethernet output.
In this section, we introduced Edgematic, provided an overview of the GUI, and reviewed some getting-started examples. In the following sections, we’ll dive deeper into Edgematic, beginning with key terminology.